December 30, 2019
Python for Data Visualization – Matplotlib Basics

DURATION
5 mincategories
Tags
share

Matplotlib is a data plotting library. Matplotlib is one of the most popular plotting libraries for Python. It gives almost every characteristic of a figure. It has the look and feel of MatLab. MatLab is another programming language with graphical plotting capabilities. It works very efficiently with Pandas and NumPy arrays.
Installation – Python 3.x (recommend using Anaconda distribution)
If Anaconda is installed on the system, open terminal/Command Prompt and type~ conda install matplotlib
In case Anaconda is not installed on your system, open terminal/Command Prompt and type~ pip install matplotlib
\
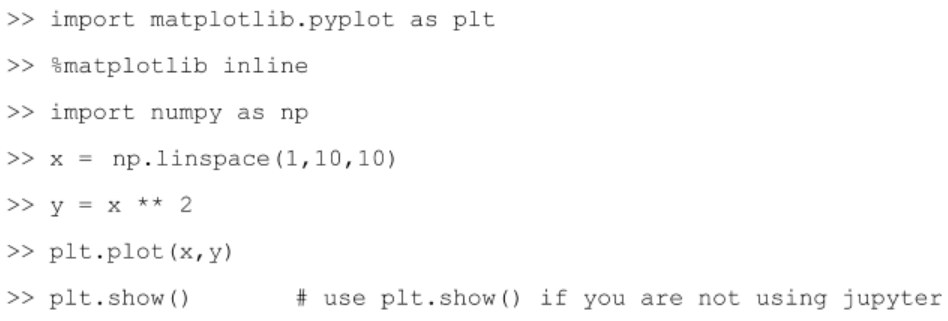
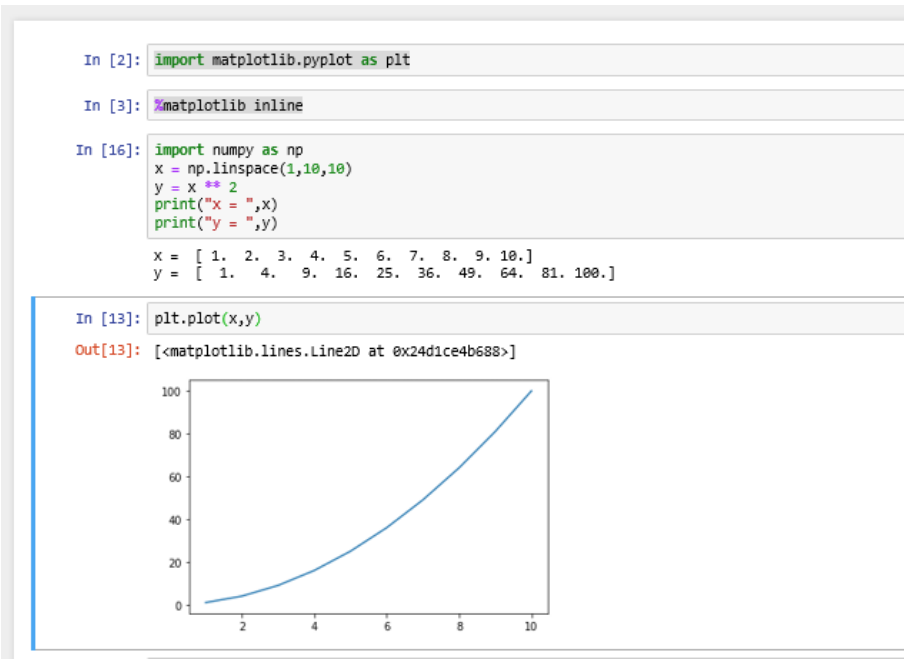
Getting started (A simple x vs y plot)
Open Jupyter notebook.
Import pyplot, NumPy.
Create two NumPy arrays x and y.
Plot the values of x and y.


Adding title and label to the axis.

Creating Multiple Plots on the same canvas using subplot ().
subplot(no of rows, no of columns, plot number)
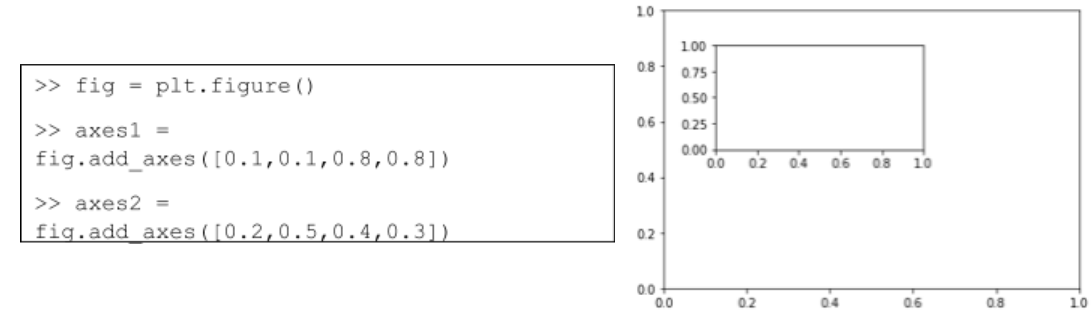
Plotting with the Object Orient Method.


Plotting two figures on the same canvas (understanding the axis values)

Plotting x and y to both the canvases with titles and axis.

Plotting subplots with Object Orient Method


Playing around with Figure Size and DPI


Multiple Plotting in the same figure
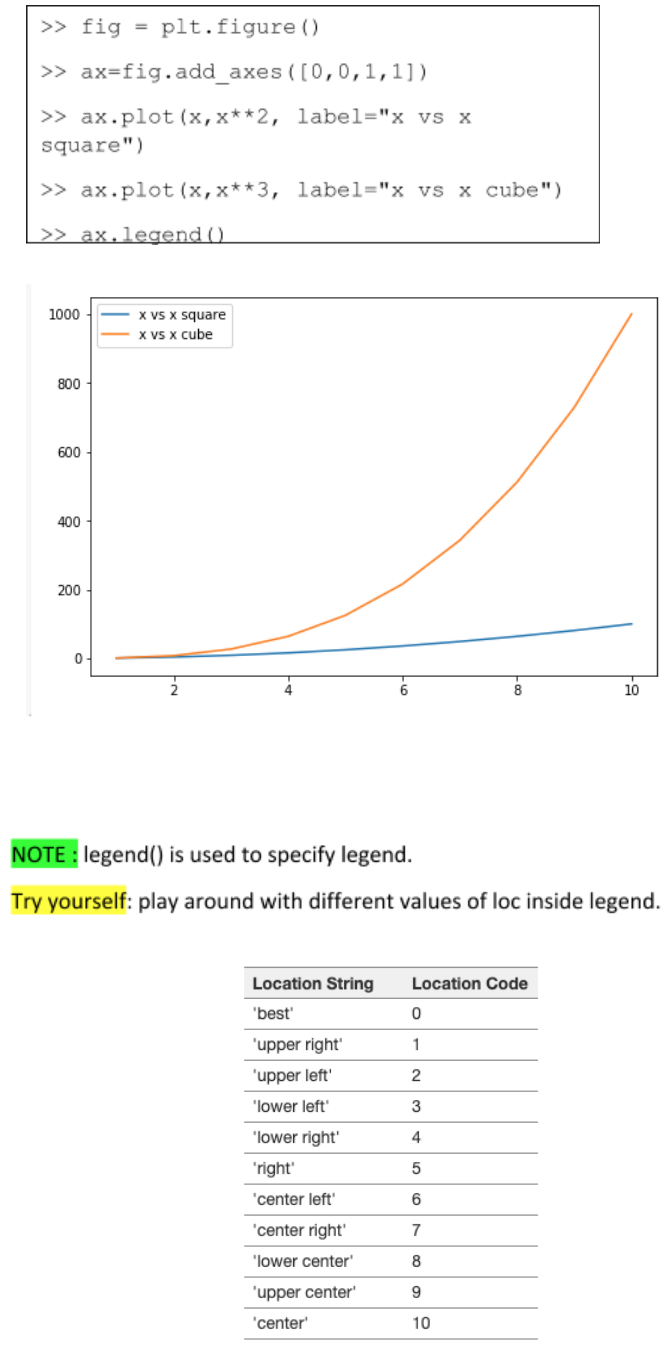
Customizing Plot


Try yourself:
Line Styles : https://matplotlib.org/3.1.0/gallery/lines_bars_and_markers/linestyles.html
Marker: https://matplotlib.org/3.1.0/gallery/lines_bars_and_markers/marker_reference.html